
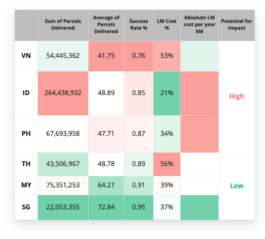
Focusing on Philippines — Prioritizing efforts on the most impactful areas, while recognizing that not all of the six operating countries are equal, From the data it is seen that Indonesia and Philippines spends the most for Last Mile cost, however Philippines delivers less than half of the volumes Indonesia handles, but spends the same amount of cost.

Focusing on Philippines — Prioritizing efforts on the most impactful areas, while recognizing that not all of the six operating countries are equal, From the data it is seen that Indonesia and Philippines spends the most for Last Mile cost, however Philippines delivers less than half of the volumes Indonesia handles, but spends the same amount of cost.